Console Guide
A field-by-field reference for every page, tab, and modal in the Echidra OSS console — what each control does, when it takes effect, and how the pieces connect.
Overview
The landing page after login. A rolling snapshot of the last 30 days of honeypot activity — nothing here is configurable, it's read-only at-a-glance reporting.
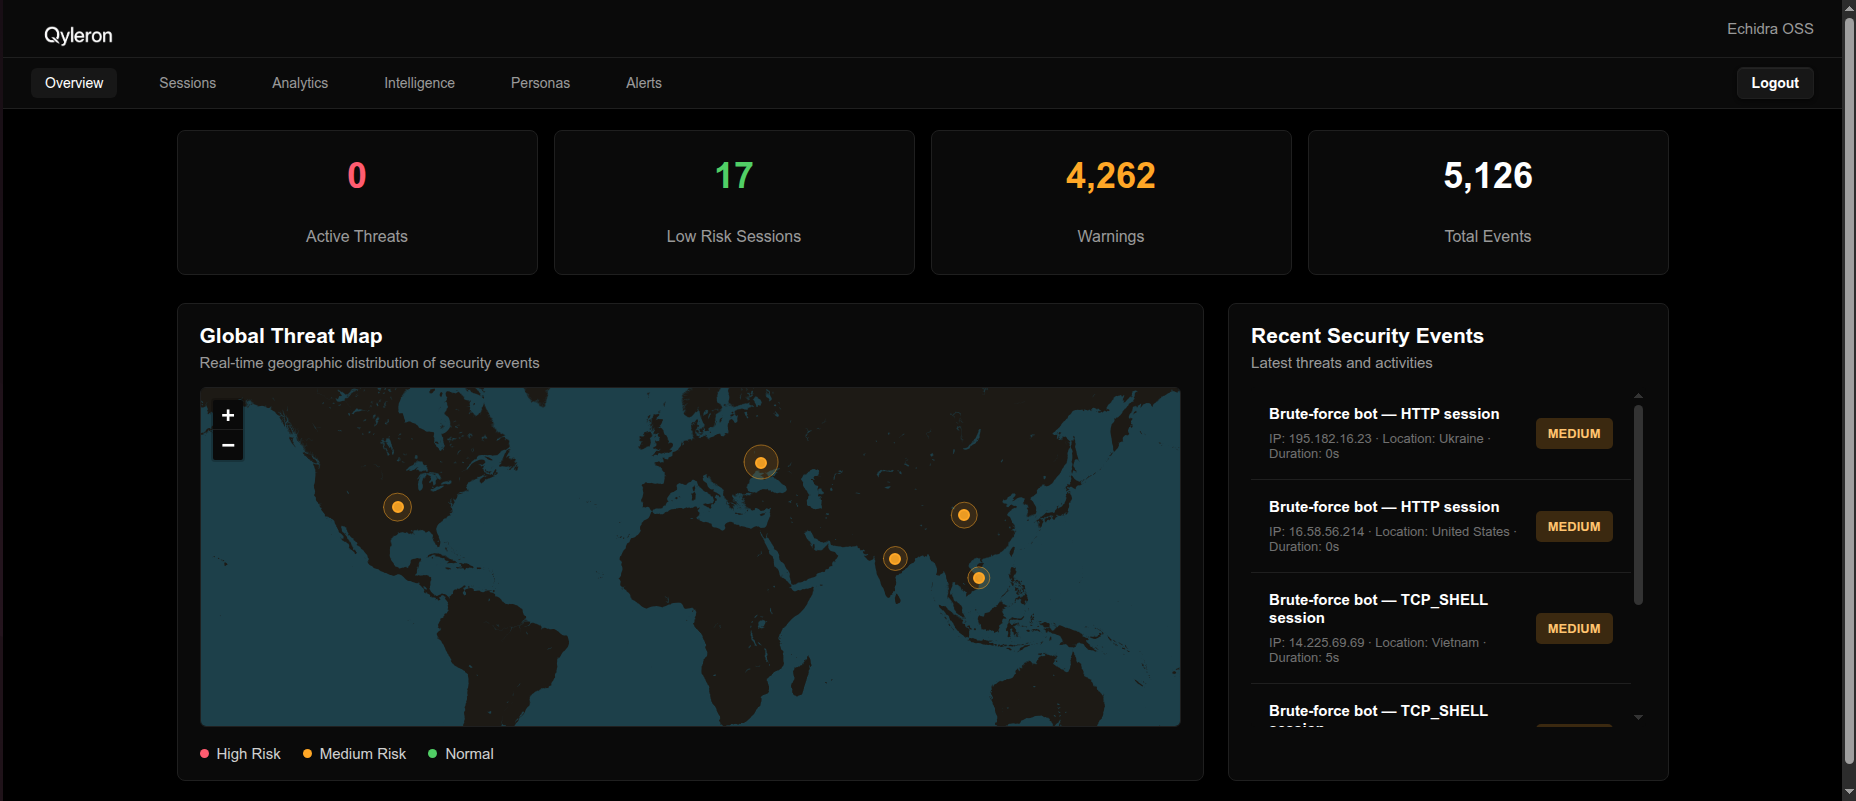 Full-page capture showing the metric cards, Global Threat Map, and Recent Security Events panel together.
What's on this page
| Section | Shows |
|---|---|
| Metric cards | Active Threats, Low Risk Sessions, Warnings, and Total Events — all counted over the reporting window. |
| Global Threat Map | One dot per unique source IP, colored by that IP's highest observed risk tier (see Risk levels). Because geolocation only resolves to a country (not a precise coordinate), same-country dots get a small deterministic offset so they don't stack exactly on top of each other — click a dot for IP, country, and duration. |
| Recent Security Events | One entry per unique source IP (most recent session for repeat visitors) — IP, country, session duration, and risk badge. Click through to Sessions for the full, filterable, per-session table. |
Sessions
Every captured attacker session, one row per (IP + Actor + Intent) pattern, newest first. This is the raw record — Intelligence (below) is the rolled-up, "what patterns keep happening" view built from the same data.
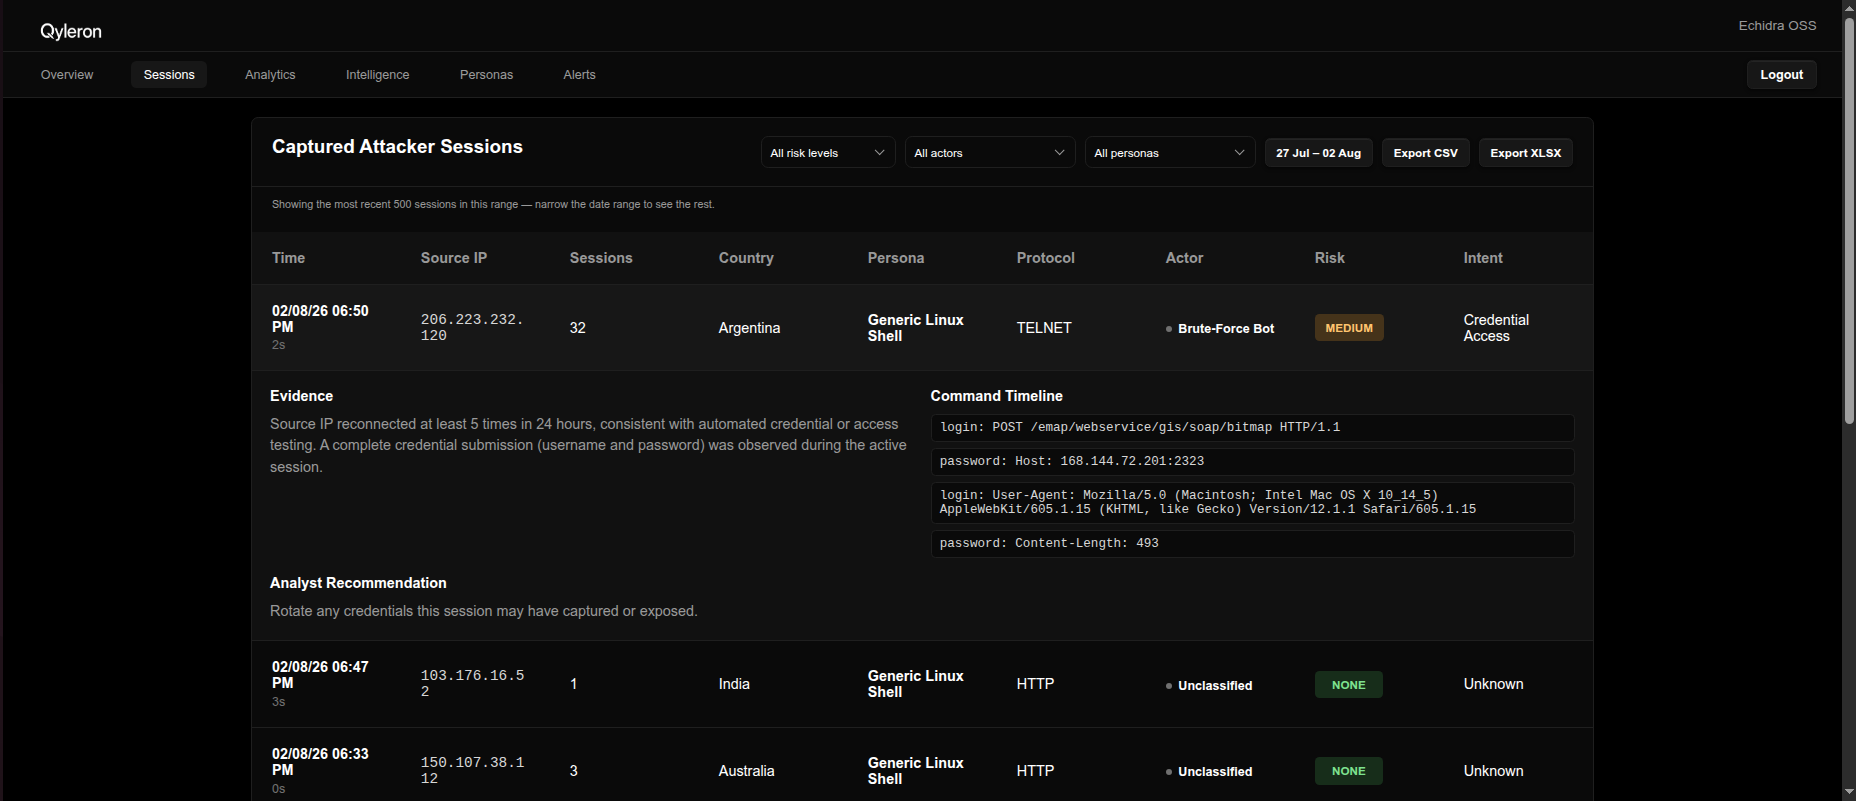 The table with a few rows visible, plus an expanded row showing the command timeline.
Table columns
| Column | Meaning |
|---|---|
| Time | When the session started. |
| Source IP | The connecting peer's address. |
| Sessions | How many times this exact pattern — same source IP, same Actor, same Intent — repeated within the selected date range. Rows are collapsed on that combination, not on IP alone: if the same IP's behavior changes (e.g. escalates from reconnaissance to credential theft), it gets its own separate row instead of being folded away. |
| Country | Geolocated from the source IP. |
| Persona | Which honeypot identity the session hit (see Personas). |
| Protocol | tcp_shell (SSH-style), http, ftp, or telnet. |
| Actor | The classifier's best-guess label for who/what this was (see Actor labels). |
| Risk | Combined risk score bucketed into a level (see Risk levels). |
| Intent | The classifier's read on what the session was trying to do — reconnaissance, credential theft, persistence, etc. |
Filtering and paging
- Risk level filter — narrows the table to one risk tier at a time.
- Row click — expands the row's representative session to show its full command log and any decoy files it touched. If a row's Sessions count is greater than 1, this shows only the most recent occurrence's transcript — the others aren't individually viewable in the table, only reflected in the count.
- Pagination — 10 rows per page; Prev/Next controls appear once there's more than one page's worth.
Export
Export CSV and Export XLSX both download the currently filtered/date-ranged table using the same (IP + Actor + Intent) grouping as the table itself — keeping the most recent matching session as the representative row, with the Sessions column showing the real repeat count. XLSX adds a bold header row and auto-sized columns; CSV stays available for quick imports or scripting. Filenames include the active date range.
Analytics
Aggregate trends across all personas over a selectable time range — the site-wide counterpart to the per-persona analytics tab described under Personas.
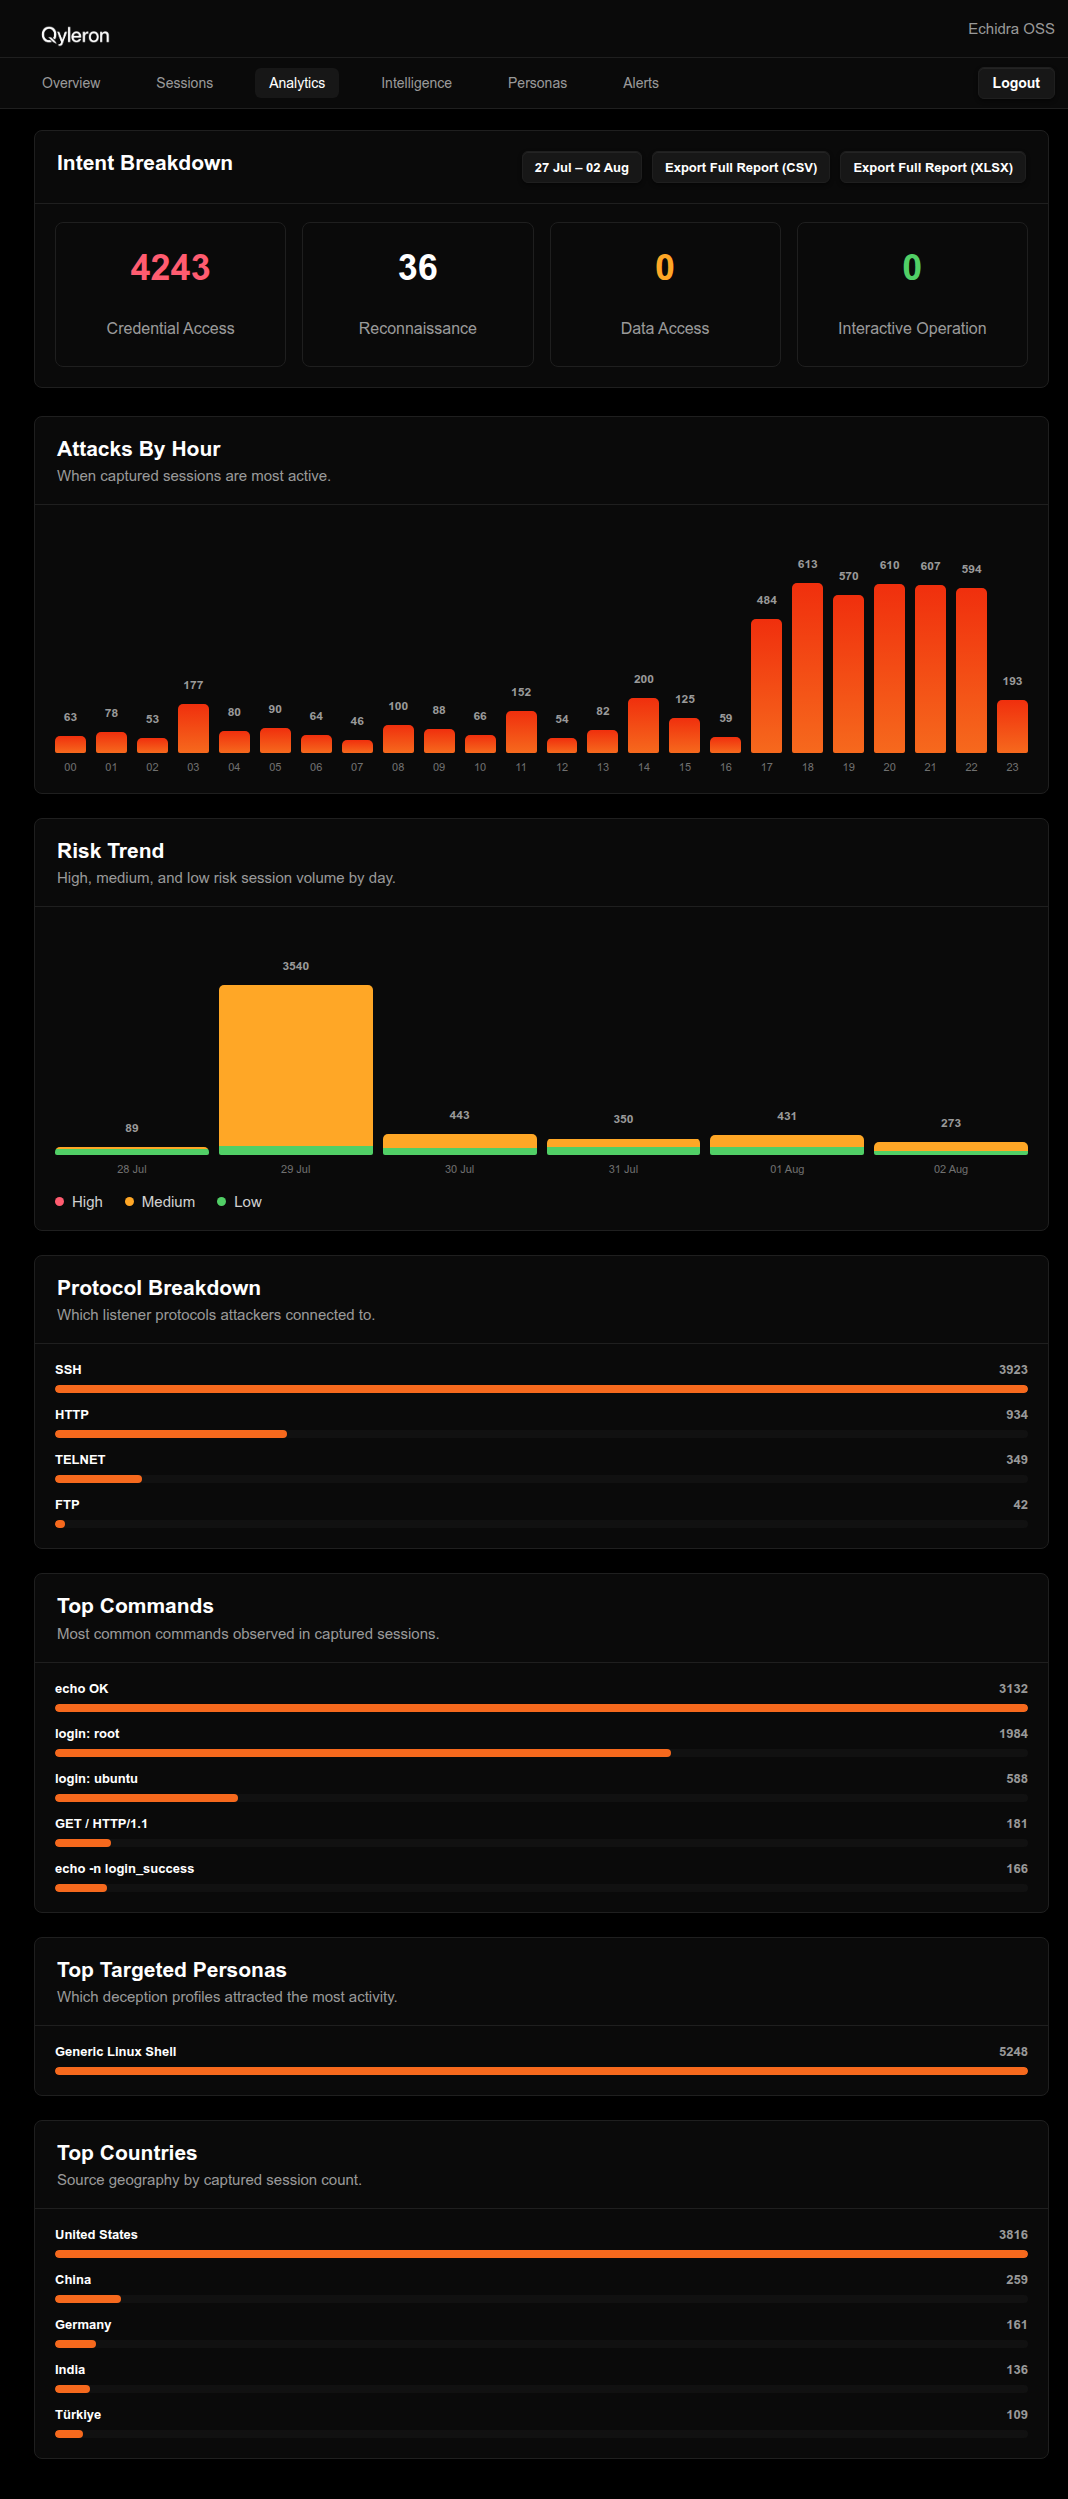 The Intent Breakdown metric cards plus the Attacks By Hour and Risk Trend charts.
Time range control
A "From date/hour" → "To date/hour" range picker in the top-right sets the reporting window; click Apply to recalculate every chart and metric against it. The picker won't let you select an inverted range (the calendar and hour dropdowns constrain each other automatically).
Charts & panels
| Panel | Shows |
|---|---|
| Sessions by Intent | Four metric cards — Credential Access, Reconnaissance, Data Access, Interactive Operation — counted over the selected range. |
| Attacks By Hour | A bar chart of session start times bucketed by hour-of-day (0–23), summed across every day in the selected range. |
| Risk Trend | Stacked High/Medium/Low bars over time — day, week, or month buckets depending on range width (see above). |
| Protocol Breakdown | Which listener protocols (SSH, HTTP, FTP, Telnet) attackers connected to, ranked by session count. |
| Top Commands | The most frequently typed shell commands across all captured sessions, ranked with a proportional bar. |
| Top Personas | Which persona(s) attracted the most sessions in range — meaningful even though only one persona runs at a time, since it reflects every persona that's been active across the selected window, not just the current one. |
| Top Countries | Source geography by session count, same ranked-bar treatment. |
Export
Export Full Report (CSV) downloads a ZIP file containing one clean, flat CSV per panel above (e.g. Attacks_by_Hour_of_Day.csv, Protocol_Breakdown.csv) — no combined multi-table file to parse apart. Export Full Report (XLSX) downloads a single workbook with the same data, one sheet per panel, bold header rows, and auto-sized columns. Both filenames include the active date range.
Intelligence
Not individual sessions — recurring issues. Every session gets classified into an actor label and a set of MITRE ATT&CK techniques; this page groups by (actor, technique) pair so the same underlying pattern doesn't show up as fifty separate rows.
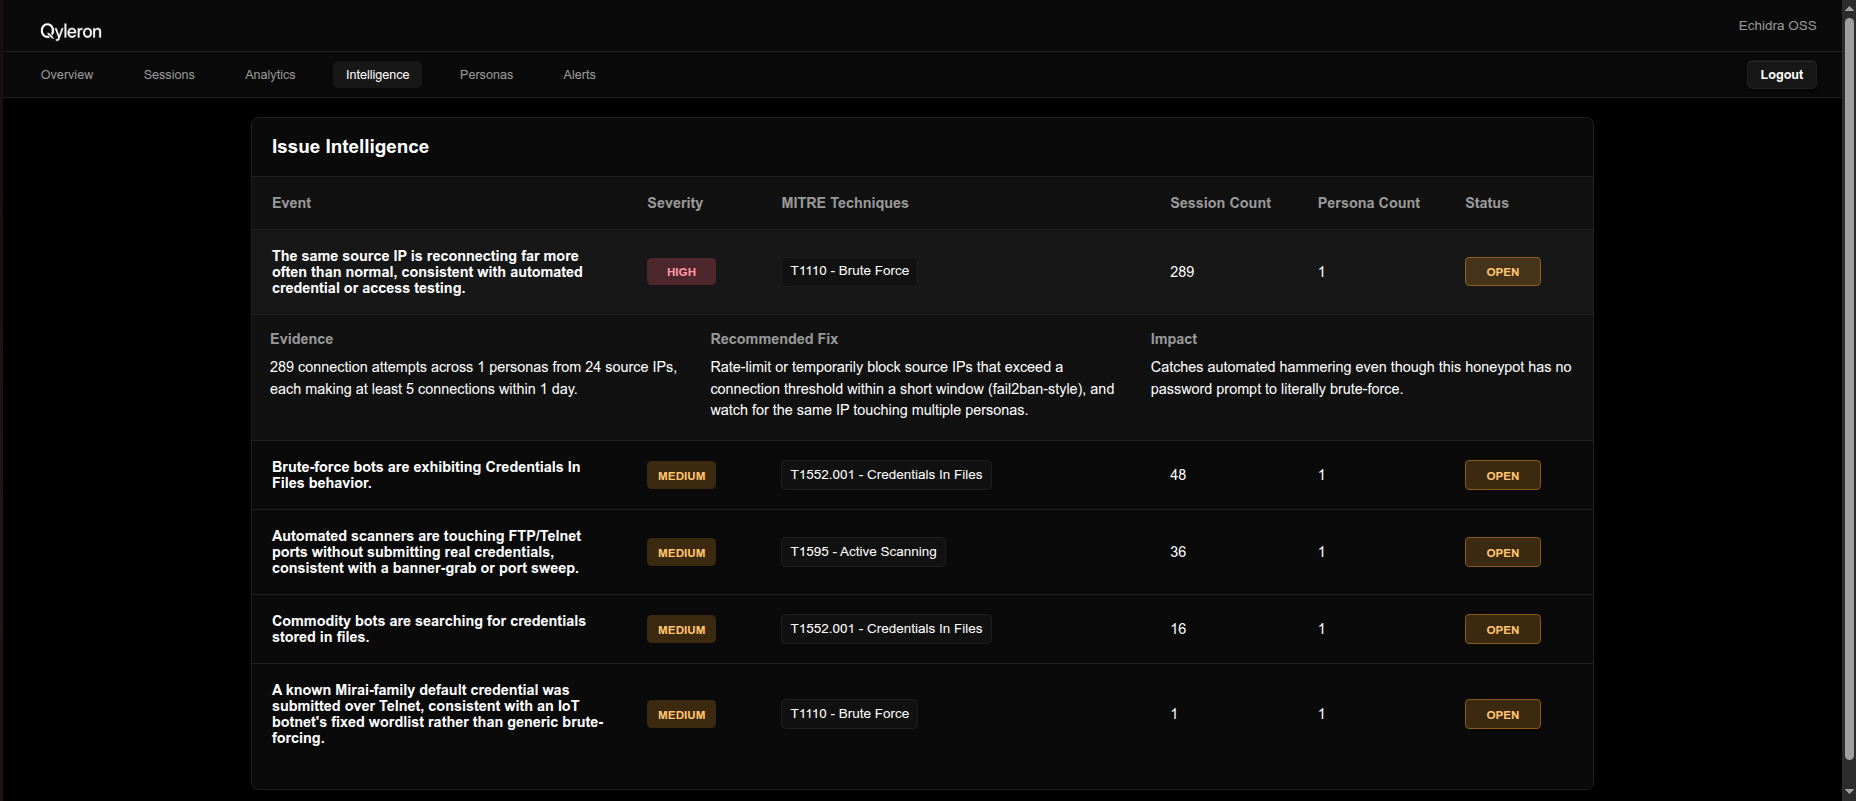 The issues table with a row expanded to show Evidence / Recommended Fix / Impact.
Table columns
| Column | Meaning |
|---|---|
| Event | A short title for the pattern, drawn from a built-in playbook keyed on the actor/technique pair. |
| Severity | High / Medium / Low (see Risk levels — Critical folds into High here). |
| MITRE Techniques | The ATT&CK technique ID(s) and name(s) this issue represents. |
| Session Count | How many distinct sessions have contributed to this issue. |
| Persona Count | How many different personas have seen this pattern. |
| Status | Open / Closed — click to toggle. Purely an analyst bookkeeping flag; it doesn't change scoring or alerting. |
Row detail
Click a row to expand it: Evidence (why the classifier flagged this), Recommended Fix, and Impact — all pulled from the same built-in playbook as the title.
Paging
10 issues per page, same Prev/Next pattern as Sessions. The page auto-refreshes roughly every 30 seconds, but pauses while you have a row expanded so it doesn't collapse mid-read.
Personas
A persona is the fake machine identity attackers see — hostname, banners, fake users, decoy files, and where its alerts go. Presets ship hardcoded; customizing one here saves an override that the live honeypot picks up automatically, no restart required (within a few seconds).
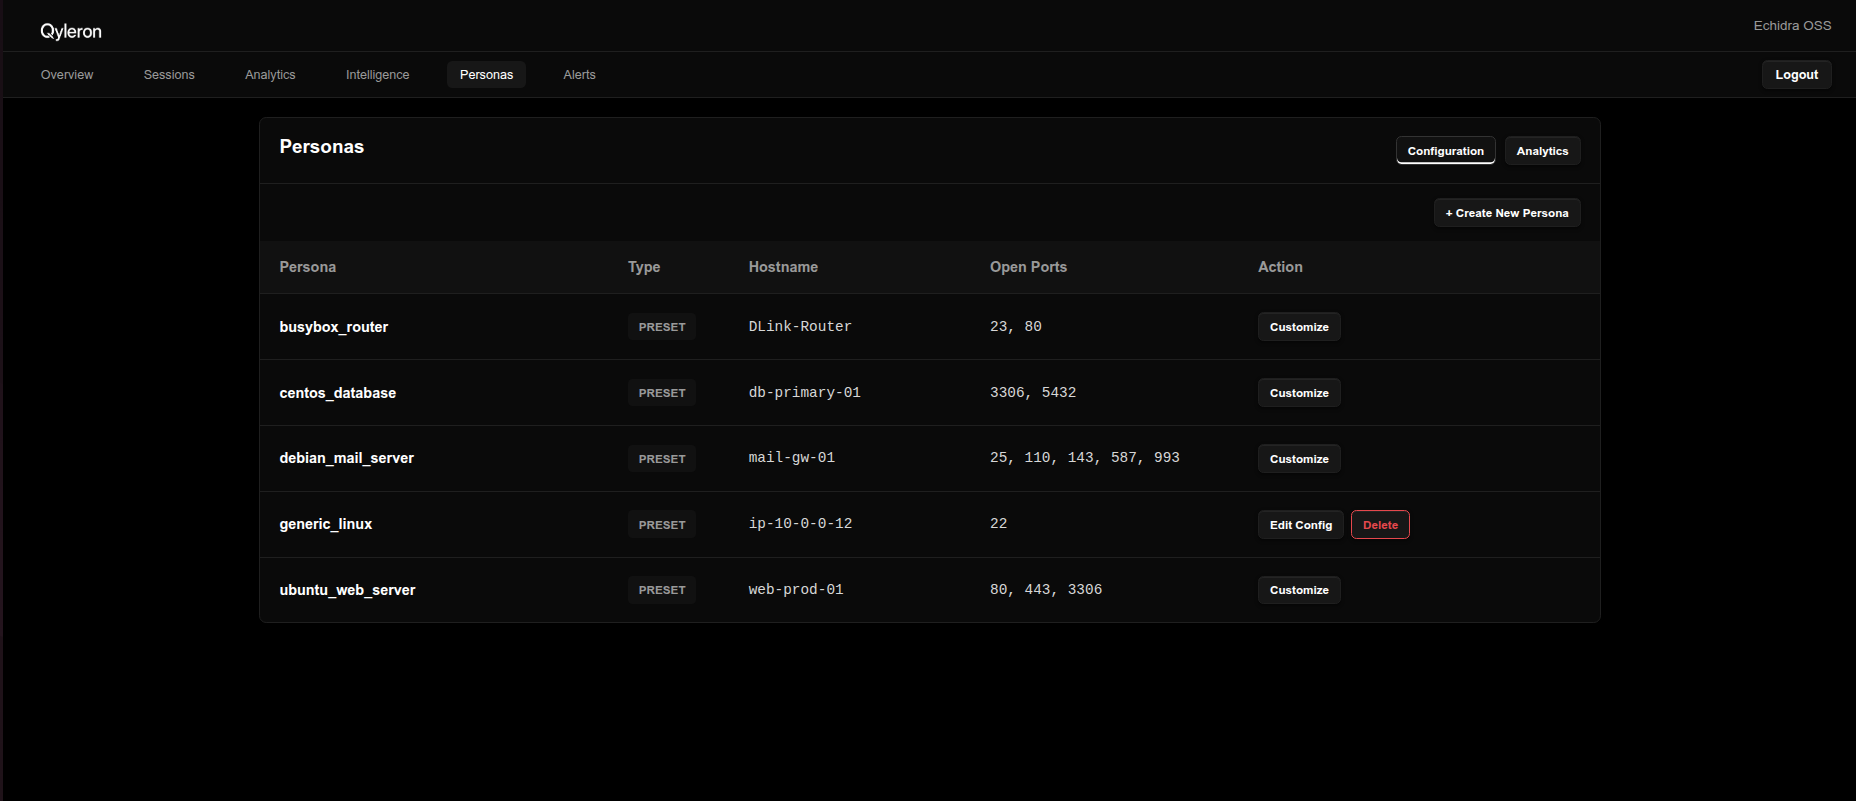 The persona table on the Configuration tab.
Two tabs, same pattern used on the Alerts page's Email/Slack toggle.
Configuration tab
A table of every persona — presets and any customized ones — with hostname, open ports, and a Customize / Edit Config action. + Create New Persona starts a brand-new one from a slug ID instead of overriding a preset.
Persona modal — Identity section
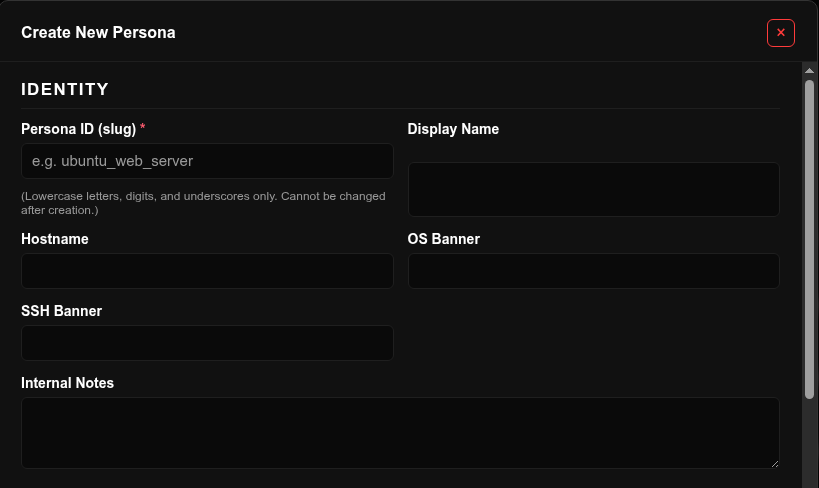 Display Name, Hostname, OS Banner, SSH Banner, and Internal Notes fields.
| Field | Description |
|---|---|
| Display Name | Label shown in the dashboard only — not visible to attackers. |
| Hostname | What hostname, the shell prompt, and login banners present. |
| OS Banner | The uname-style string shown to the attacker. |
| SSH Banner | The SSH server version string presented before authentication. |
| Internal Notes | Analyst-only scratch space — never shown to attackers, not used by scoring. |
Persona modal — Deception section
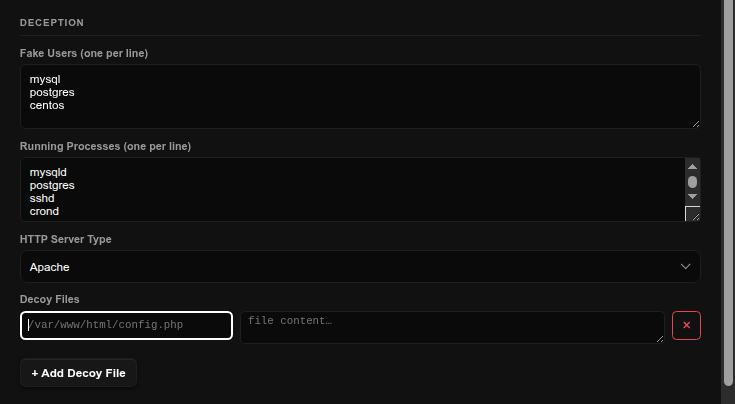 Fake Users, Running Processes, HTTP Server Type, and Decoy Files fields.
| Field | Description |
|---|---|
| Fake Users | One username per line — shown in /etc/passwd-style output and similar enumeration commands. |
| Running Processes | One process name per line — what a fake ps/process listing shows. |
| HTTP Server Type | Which fake web server the HTTP listener presents (nginx / Apache / BusyBox), or None to reject all HTTP requests for this persona outright. |
| Decoy Files | Path + content pairs. When an attacker reads one of these paths (e.g. cat /etc/passwd), this content is what comes back. Also drives the "decoy files surfaced" evidence used in scoring. |
Persona modal — Alerting section
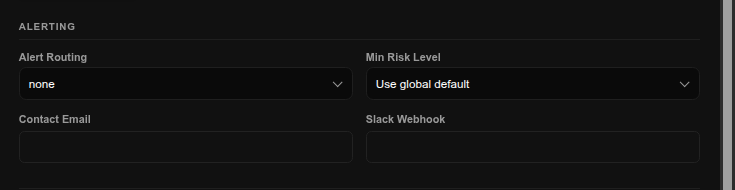 Alert Routing, Min Risk Level, Recipient Email, and Slack Webhook fields.
| Field | Description |
|---|---|
| Alert Routing | None / Email / Slack / Both — which channel(s) fire for sessions on this persona. Setting this to a value that excludes a channel automatically disables that channel's destination field below (it can't take effect either way). |
| Min Risk Level | The risk floor for this persona's alerts. Leave on "Use global default" to inherit the site-wide threshold set on the Alerts page; set explicitly to override it — this can loosen the bar (e.g. alert on Low) as well as tighten it. |
| Recipient Email | Where this persona's email alerts go. Only editable when Alert Routing includes Email. |
| Slack Webhook | An https://hooks.slack.com/… incoming webhook URL. Only editable when Alert Routing includes Slack. Test it from the Alerts page's Slack tab before saving. |
Analytics tab
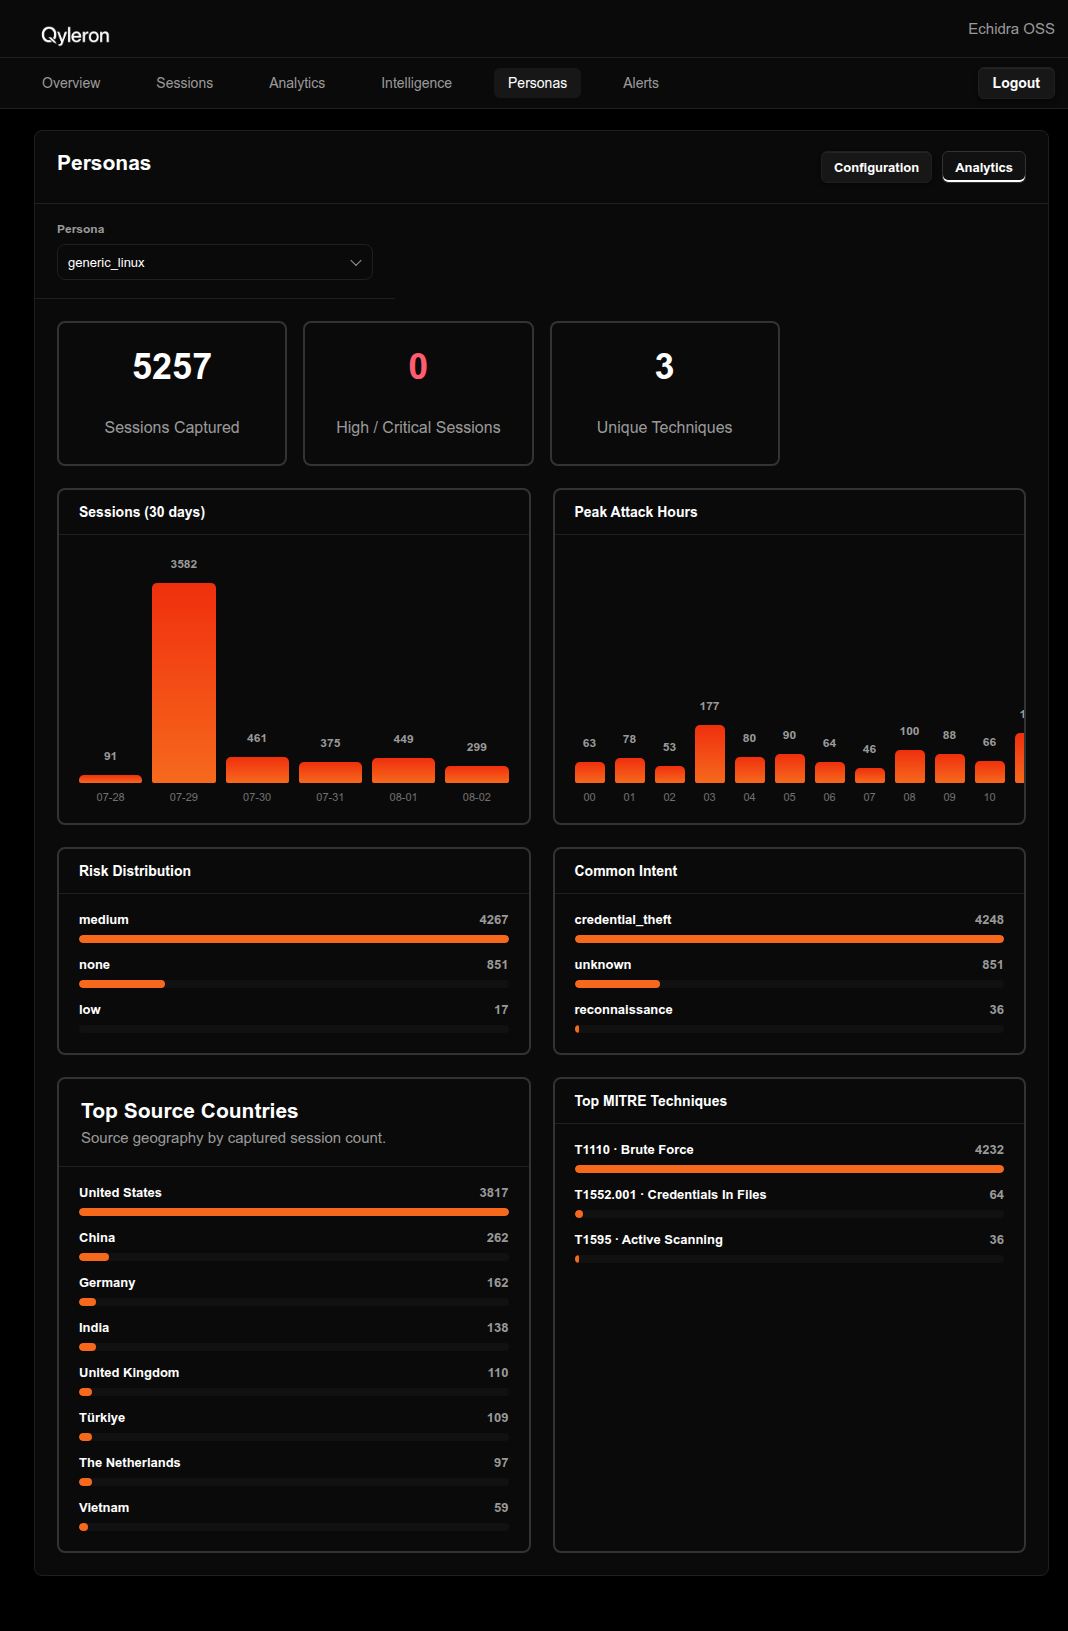 The persona dropdown plus the scoped cards, trend chart, and ranked-bar panels below.
Pick a persona from the dropdown to see stats scoped to that persona only:
| Card / Chart | Shows |
|---|---|
| Sessions Captured | Total sessions against this persona. |
| High / Critical Sessions | How many of those sessions scored High or Critical risk. |
| Unique Techniques | Distinct MITRE technique count observed. |
| Sessions (30 days) | A daily trend chart. |
| Peak Attack Hours | Same hour-of-day breakdown as the Analytics page's Attacks By Hour chart, scoped to this persona. |
| Risk Distribution | Ranked bar list of sessions per risk level. |
| Common Intent | Ranked bar list of classified intents. |
| Top Source Countries | Same ranked-bar format as the site-wide Analytics page. |
| Top MITRE Techniques | Technique ID and name combined (e.g. T1110 · Brute Force), ranked by how often each was observed. |
Alerts
Global notification configuration, plus a history of every alert the system has actually attempted to send. Per-persona routing (who gets alerted, and at what risk threshold) is configured on the Personas page, not here.
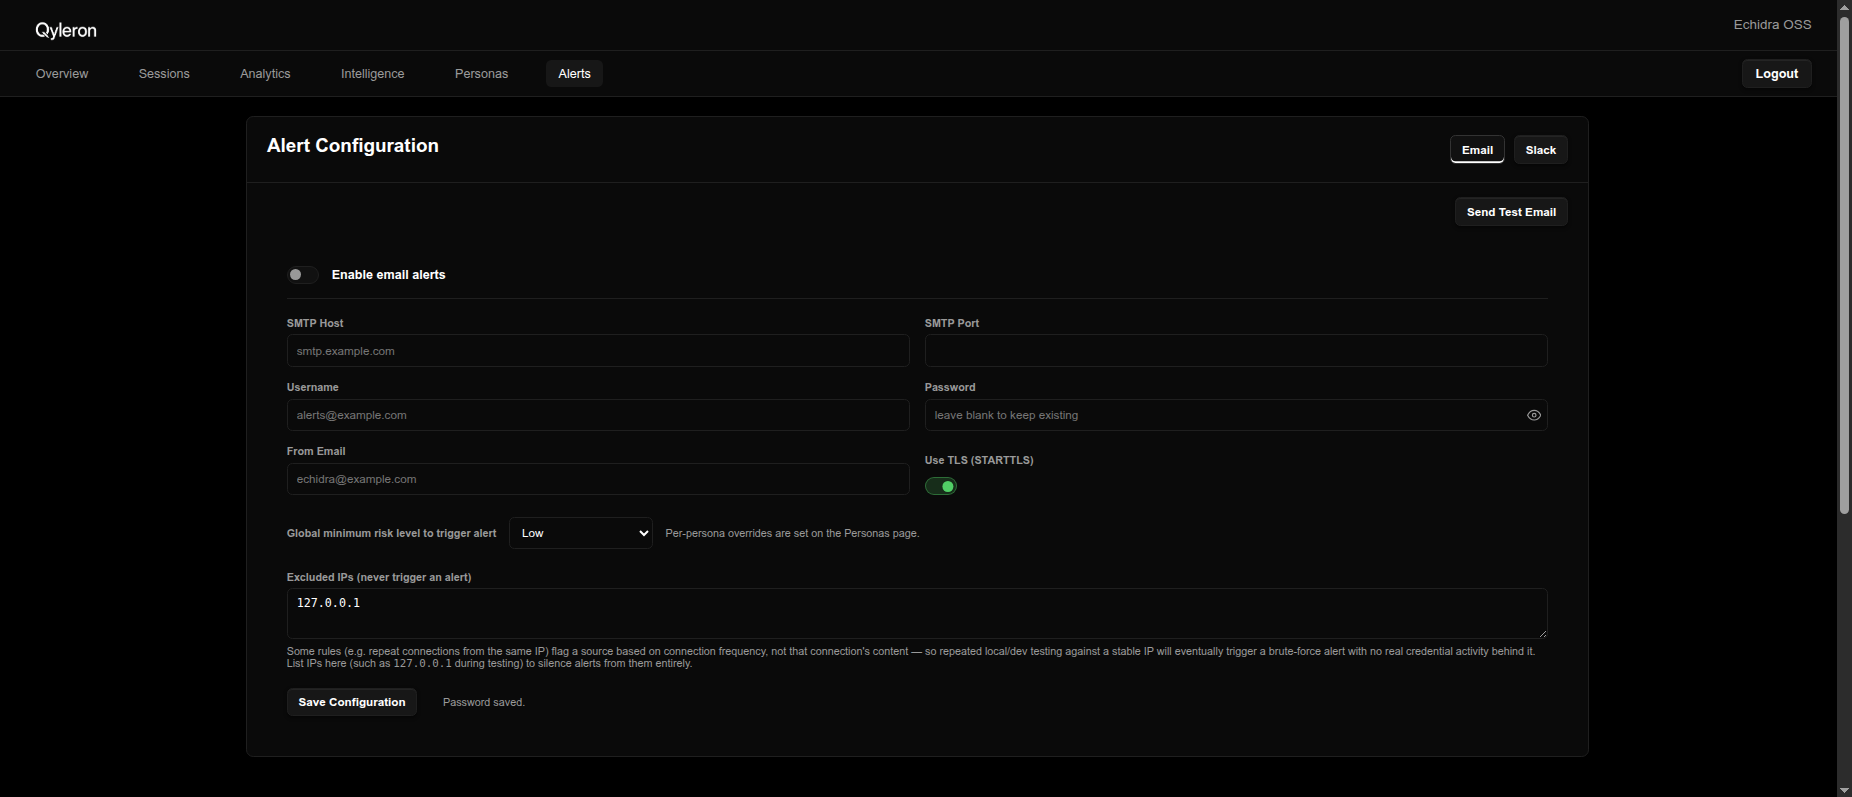 The Email tab's SMTP configuration form, plus the Alert History table below it. Use a demo SMTP account/From Email here, not a real personal inbox.
Email tab — SMTP configuration
| Field | Description |
|---|---|
| Enable email alerts | Master switch. Off means no email sends regardless of any persona's routing. Saves immediately when toggled — no need to also click Save Configuration for this field. |
| SMTP Host / Port / Username / Email App Password | Your mail provider's SMTP credentials. Most providers (Gmail, Outlook, etc.) require a per-app password here rather than your real account password. It's encrypted at rest and never re-displayed — leave it blank on a re-save to keep the existing one. |
| All fields above | Disabled whenever Enable email alerts is off, since nothing will send regardless of what's filled in. |
| From Email | The sending address shown to recipients. |
| Use TLS (STARTTLS) | Leave on unless your provider explicitly requires plaintext. |
| Global minimum risk level | The site-wide default alert threshold. Any persona that hasn't set its own Min Risk Level override inherits this value. |
Send Test Email fires a real send using the currently saved configuration (requires Enable email alerts to be on, plus SMTP Host and From Email set) — a quick way to verify credentials before relying on them. Its result message appears next to the button itself, separate from Save Configuration's own status message.
Slack tab
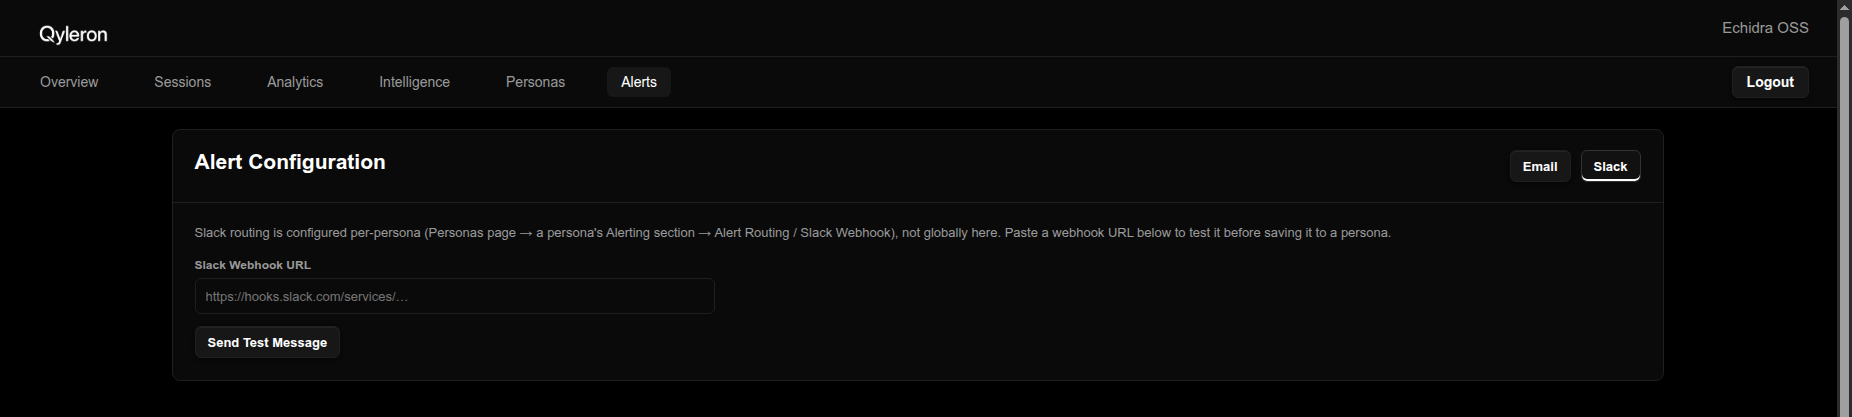 The webhook URL field and Send Test Message button.
Slack routing is per-persona (see Personas → Alerting section), not global — this tab exists purely to test a webhook URL before you paste it into a persona's config. Paste the webhook, click Send Test Message, and check the channel. Only https://hooks.slack.com/… URLs are accepted.
Alert History
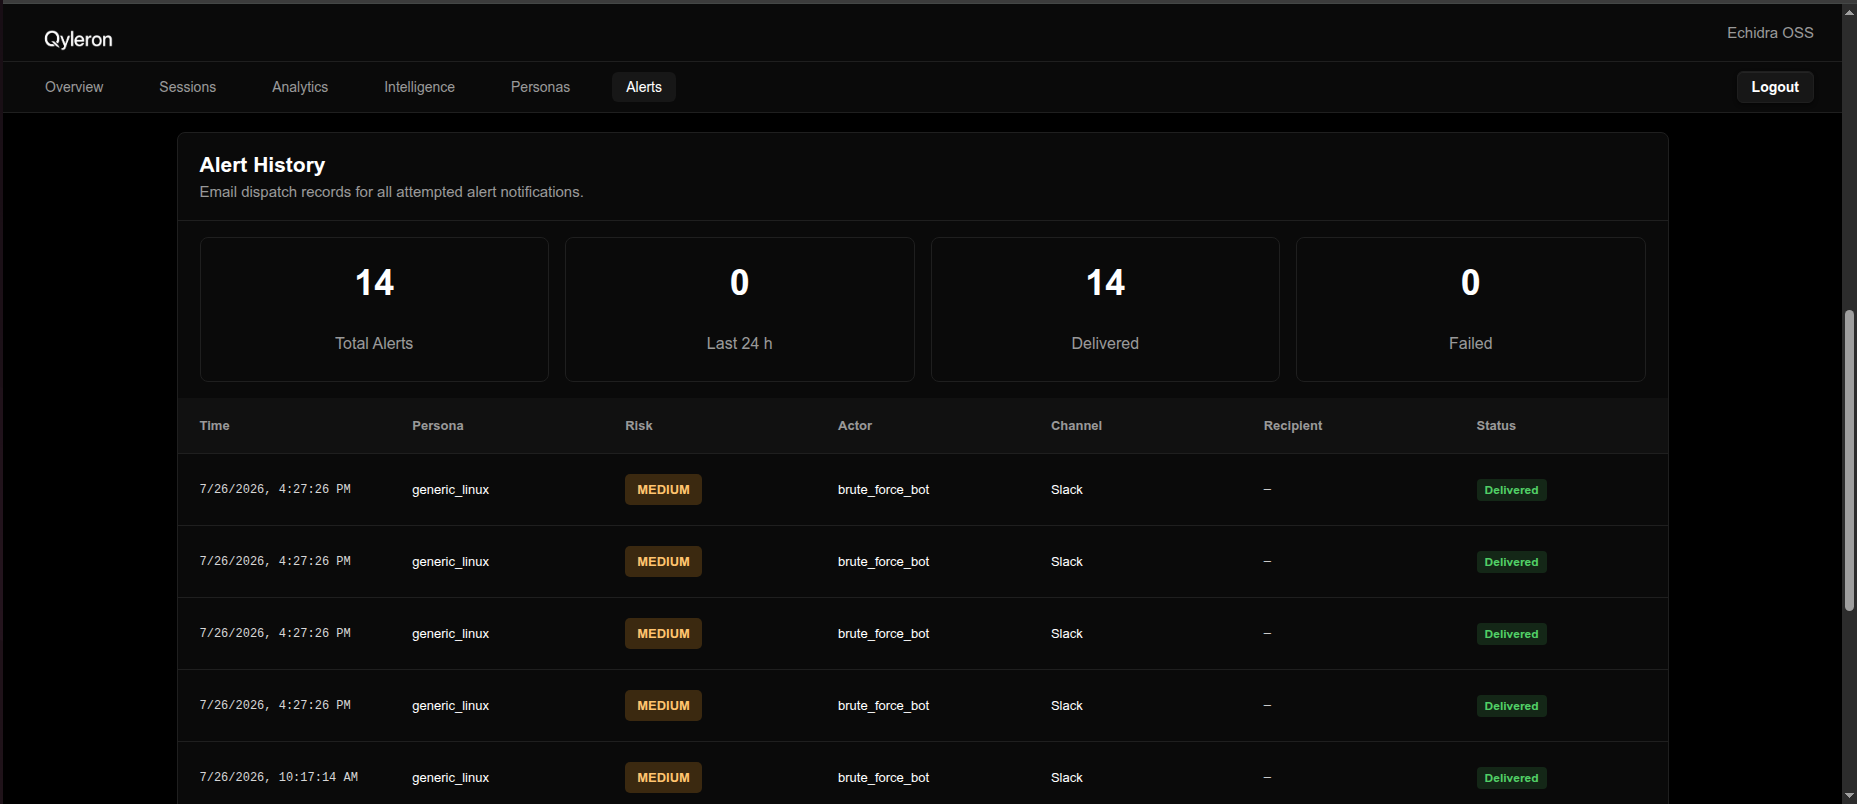 The metric cards and the delivered/failed alert table below them. Set the persona's Recipient Email to a demo address (e.g. demo@example.com) before generating these alerts — the Recipient column will show whatever real address was configured at send time.
| Column | Meaning |
|---|---|
| Time | When the alert was dispatched. |
| Session | A truncated session ID (hover for the full value) — cross-reference it against the Sessions page to pull up that session's full transcript. |
| Persona | Which persona's session triggered it. |
| Risk | The triggering session's risk level. |
| Actor | The classifier's actor label for that session. |
| Channel | Email or Slack. |
| Recipient | The persona's Recipient Email, where applicable. |
| Status | Delivered or Failed — hover a failed row for the error detail. |
Metric cards above the table summarize Total Alerts, Last 24h, Delivered, and Failed counts. 10 rows per page.
Why an alert might not fire
- Global Enable email alerts is off (email only — Slack has no separate global switch).
- The persona's Alert Routing is
none, or doesn't include the channel you expected. - The session's risk level doesn't meet the effective threshold (persona override, or the global default if none is set).
- The destination field (Recipient Email / Slack Webhook) is empty for the channel that's supposed to fire.
Risk levels
Every classified session gets a 0–100 risk score, bucketed into one of five levels used consistently across every page.
| Level | Score range |
|---|---|
| Critical | 85–100 |
| High | 65–84 |
| Medium | 40–64 |
| Low | 1–39 |
| None | 0 — no rule matched |
Actor labels
A best-guess classification of who or what was behind a session, based on deterministic rules over session behavior — not a model call.
- brute_force_bot — a completed username+password submission, or repeated connections from the same source IP. This is the most common label; the honeypot has no way to distinguish your own manual testing from a real attacker.
- script_kiddie — recognizable off-the-shelf tool names typed at the shell.
- skilled_human_operator — timing and command patterns consistent with a real person working interactively, not a script.
- Others are added via
classifier/rules/default_rules.yaml— new patterns don't require touching scoring code.
Glossary
| Term | Meaning |
|---|---|
| Persona | The fake machine identity a connection sees — see Personas. |
| Session | One connected client's full interaction, start to end. |
| Classification | Turning a raw session into an actor label, risk score, and MITRE tags. |
| Issue | A recurring (actor, technique) pattern rolled up across sessions — see Intelligence. |
| Decoy file | Fake file content served to an attacker who reads a specific path. |
| Alert routing | Per-persona choice of which channel(s) — email, Slack, both, or none — get notified. |